InDriver vs Uber – Which Business Model Is More Profitable in the US?
InDriver vs Uber – Which Business Model Is More Profitable in the US?
Last Updated on November 13, 2025
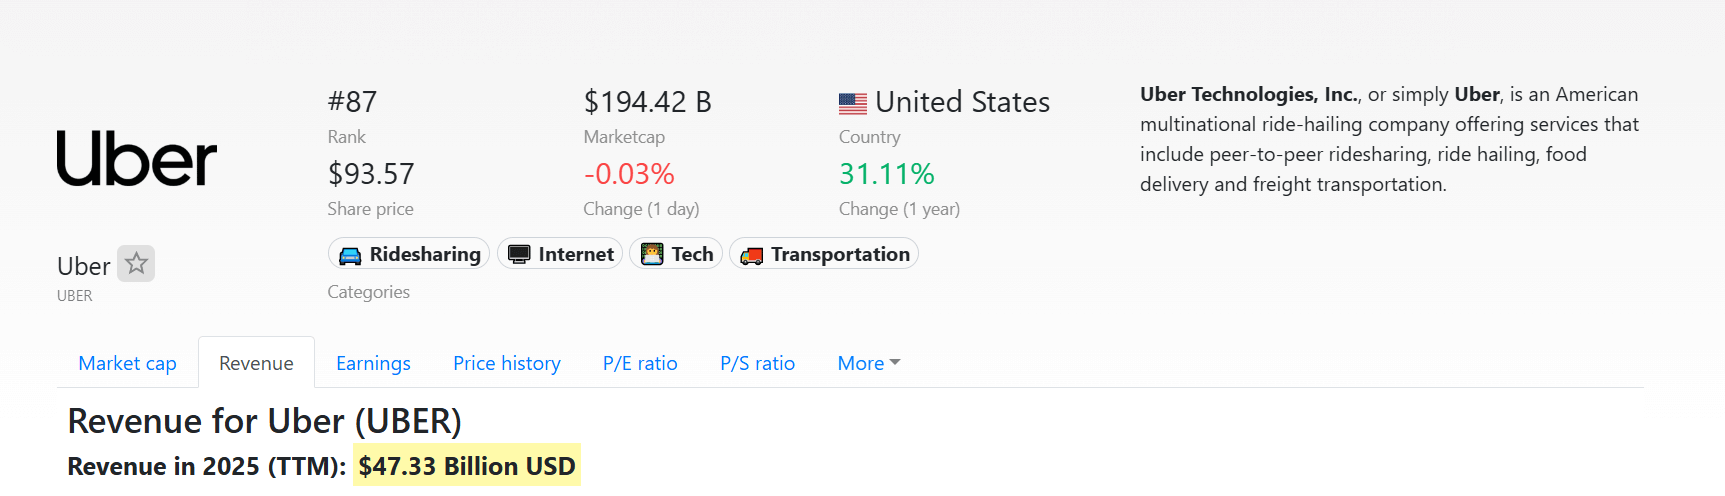
Key Takeaways What You’ll Learn: Uber and InDriver follow two very different profit models in ride-hailing. Uber uses algorithmic pricing, while InDriver lets riders and drivers set fares. Uber’s size and brand give it higher total profits in the U.S. market. InDriver focuses on fairness, transparency, and stronger driver retention. Both models reveal new ways to balance profit, cost, and user trust. Stats That Matter: Uber’s 2024 revenue reached $47.33 billion, growing 18% year-over-year. Its Adjusted EBITDA hit $6.48 billion, showing strong operational profit. InDriver operates in 48+ countries with 175M+ downloads worldwide.
The ride-hailing industry in the United States has become a hallmark of modern convenience. Whether it’s catching an early-morning ride to the airport or heading home after a late night out, ride-hailing services like Uber and InDriver have made getting from point A to point B as easy as a few taps. But behind that simplicity are two very different business philosophies. Uber, the established market leader, relies on algorithmic pricing, large-scale operations, and seamless user experience. InDriver, on the other hand, challenges the norm by letting riders and drivers negotiate fares directly, creating a sense of fairness and flexibility that users appreciate. As both companies compete for traction in U.S. cities, one question stands out: which business model proves more profitable in America’s ride-hailing market? It’s hard to imagine city life without ride-hailing. This model disrupted traditional taxis and changed urban mobility forever. While exact future projections vary, the U.S. ride-hailing and taxi segment is expected to grow strongly into the mid-2020s. Uber has long dominated this space with a strong position in U.S. markets and globally. At the same time, driver-partners have raised concerns about commission levels, and riders have pointed out high surge fares or fare unpredictability. That has opened opportunities for more transparent, alternative models. That’s where a ridesharing app like InDriver enters the picture. By putting fare negotiation into the hands of the user and the driver, InDriver’s model proposes a different value proposition: transparency, lower fares for riders, and higher retention for drivers. In a competitive U.S. market, such differentiation is meaningful. Uber connects passengers and drivers via its app, and typically takes a commission on each ride (often cited as ~20-30% though exact splits vary). The platform sets fares through dynamic pricing algorithms that incorporate distance, time, supply/demand imbalances, and surge multipliers. Uber has evolved beyond pure ride-hailing, branching into delivery (Uber Eats), freight, business-solutions, advertising, memberships (Uber One), and even autonomous vehicle partnerships. This diversification helps mitigate cyclical fluctuations in ride demand and broadens its profit base. Uber’s 2024-2025 financial results showcase its global and U.S. strength: Due to its scale, brand recognition, diversified business units, and network effects, Uber’s model benefits from high volumes, cross-selling ability, and cost leverage. That makes it financially strong in the U.S. market. The large fixed-cost base is justified by high ride volumes + multiple revenue streams. Related Read: Uber’s Business Model InDriver operates a bid-based model: passengers state the fare they are willing to pay, drivers nearby can accept, reject or counter. This approach gives more control to both parties, as opposed to fixed algorithmic fares. Upon its U.S. entry (e.g., NYC in 2018), InDriver initially charged zero percent commission for drivers for six months, then a very low commission (5-8 %) versus higher levels charged by other platforms in that market. Because drivers keep a larger portion of fare and the platform has fewer overheads (fewer local infrastructure investments, less marketing in early stages), the cost structure is leaner. InDriver launched its U.S. presence in New York City in 2018 and more recently in South Florida in 2023. However, its U.S. penetration remains significantly smaller than Uber’s. While globally InDriver is present in 48+ countries and over ~655 cities (per one source) with 175 million+ downloads, its U.S. footprint is relatively nascent. Because InDriver charges much smaller commissions and its model relies on negotiation (which may result in fares slightly lower than standard ride-hail rates), per-ride margins for the platform could be modest but the driver/consumer alignment may enhance retention and reduce churn. However, total volume in the U.S. is low relative to Uber, which limits aggregate revenues and profits for now. If we look strictly at the numbers and the U.S. market, Uber holds the lead. Its scale, brand reach, diversification and strong recent profitability metrics mean it is better positioned to generate high profits in the U.S. context. By contrast, InDriver offers a compelling and lean alternative, with a model built around fairness and transparency but its smaller U.S. scale means it is not yet at the same profitability level as Uber in aggregate. Whether you aim to build an Uber-like ride-hailing platform or a InDriver, Oyelabs provides end-to-end solutions tailored to your business vision. Our white-label ride-hailing app is built for scalability, featuring real-time tracking, flexible pricing, secure payments, and an intuitive driver dashboard, everything you need to attract users and grow revenue. From custom features to seamless user experience, we design platforms that balance profitability, transparency, and innovation. Partner with Oyelabs today to bring your on-demand transportation idea to life and compete confidently in the evolving U.S. ridesharing market. So, which model is truly more profitable in the U.S.? If we look strictly at the numbers, Uber wins. Its massive scale, broad ecosystem approach, and proven profitability metrics in 2024 give it an unmatched financial edge in the U.S. market. However InDriver’s negotiation-based system offers something that Uber doesn’t: transparency, driver-friendly economics, and a lean cost structure. By empowering users to set prices and minimising platform control, InDriver represents a potential future of ethical ride-hailing. For entrepreneurs, including those launching on-demand matchmaking platforms, that model holds real appeal. In the end: Uber dominates in profits today, but InDriver offers a strategic alternative and depending on market conditions, fairness-oriented platforms can win hearts, drivers and sustainable margins. The story of profitability in U.S. ride-hailing is still being written. 1. How does InDriver verify driver and passenger safety during rides? 2. Can InDriver’s negotiation model work efficiently in large U.S. cities? 3. Does Uber still dominate all major U.S. cities? 4. How do ride-hailing apps handle surge pricing differently? 5. Which platform benefits drivers more financially? 6. Can new startups build similar apps to Uber or InDriver?
How Ride-Hailing Took Over American Streets
How Uber’s Business Model Works
Commission & Pricing Structure
Diversified Revenue Streams
Financial Performance and Profitability
U.S. Implications for Profitability
Understanding InDriver’s Business Model
Peer-to-Peer Fare Negotiation System
Lower Commission & Leaner Costs
U.S. Presence and Scale Limitation
Profitability Potential
Which Model Is More Profitable in the US?
Scale vs. Efficiency
Profitability Per Ride vs. Aggregate Profits
Comparative Factors
Factor
Uber
InDriver
U.S. Market Share
Very large (dominant player)
Small, emerging presence
Revenue Model
Commission 20-30% (approx) + diversified services
Passenger-driver fare negotiation + low/flat fees
Operating Cost Structure
High (marketing, tech, global infrastructure)
Lower (lean footprint, fewer layers)
Driver Earnings (take-home)
Lower relative to fare due to higher commission
Higher proportion of fare to driver
Scalability
High (global, multi-services)
More selective, culturally adapted
Profit Margin Potential
Moderate per ride but high aggregate profit
Potentially higher per ride for driver + fairer system, but lower aggregate profit
Launch Your Own Ride-Hailing Business with Oyelabs
Conclusion
FAQs
InDriver ensures safety through verified driver profiles, GPS tracking, trip-sharing options, and a built-in emergency button for instant support.
Yes. With enough active drivers and riders, InDriver’s negotiation model keeps fares fair and wait times short, even in busy metro areas.
Yes. Uber remains the leading ride-hailing service across major U.S. cities due to its vast driver network, brand trust, and steady demand.
Uber uses automated surge pricing during peak hours, while InDriver avoids it by letting riders and drivers agree on the fare directly.
InDriver offers higher earnings per ride due to low commissions, while Uber provides consistent demand and steady ride opportunities.
Yes. With Oyelabs’ white-label ride-hailing solutions, startups can quickly launch scalable platforms like Uber or InDriver with essential features built in.